Many companies are not aware of the problems their customers are having on their websites. In large part, that’s because they don’t have analytics that tells them how many people fail to complete what they want or need. It's like a restaurant not knowing how many people ordered the cheesecake but didn't finish it, and why customers didn't finish their dessert. Task Analytics has a simple metric for this: the completion rate. Let's use a real-world example to demonstrate.
Task Analytics uncovered exactly what those customers who failed to complete their task did instead, and the results showed evidence of a very direct link between completion rate customer-service cost: 20% said they would contact customer service by chat. 17% said they would call customer service. And 8% said they would send an email. What’s even worse, though, was that 9% of the unsuccessful visitors said they would go to a different company. The cost of frustration can be very high.
If the company could increase its completion rate by only 1%, that would have a direct impact on both costs and revenues. But before they jumped to a solution, they first had to find the right problems to solve, and it’s very easy to jump to a solution that doesn’t actually solve the problem. As Ash Maurya says, “Love the problem, not the solution”. But where should they focus their efforts to improve the overall completion rate? They needed to make a problem list by following these steps. (1) Find a problem (2) Dig into the problem (3) Understand the problem.
The benefit of using Task Analytics is our focus on user tasks. You can identify which tasks contribute the most to the overall completion rate, and then deep dive into this task by looking at the problems and consequences related to it.
Here's how Task Analytics help companies find and understand problems:
1. Find a key user task with a low completion rate.
Imagine a company’s website has a task with high demand, but a low completion rate. Out of 100 tasks, one has almost 4% of the overall demand, with completion rate at only 58.2%. Let’s say it’s the task “find subscription prices”—an important one, no doubt!
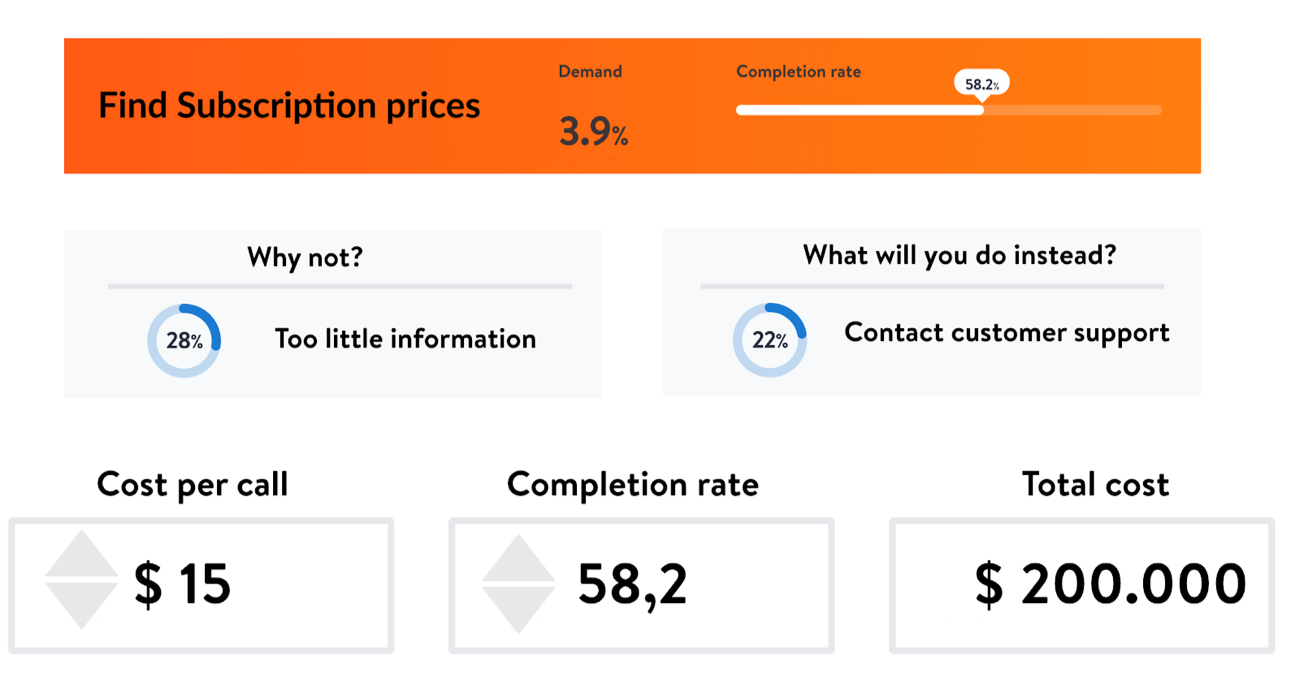
Now imagine that of those who failed in this task, 31% say they choose a different vendor, with subscription information easier to find. 22% said they would contact customer service. Both of those come at a cost to the company.

2. Dive into the problem descriptions submitted by users.
Let’s dive deeper into our (hypothetical) data: The main problem was that people couldn’t find the information they were looking for. To be precise, 46% couldn’t find what they were looking for, and 28% said there was too little information
when they did. Task Analytics also collected comments related to the task, and many users said that prices for different subscription were unclear. Multiple comments said, “What is the minimum subscription period?”
The company had recently run many campaigns, so it seemed safe to assume that those who came to check subscription prices were not current customers, but new leads generated by those campaigns. What Task Analytics showed, however, was that 56% were current customers. What this tells us is that their current customers care about the price, and were most likely comparing what they’re paying for today with another vendor.
3. Take a deeper look into behavior by sending Task Analytics data to Google Analytics and Hotjar.
The company had a website with too much content, too many pages and even duplicates of the same content. Some was up-to-date and some weren’t. Before they could start deleting pages and re-structure their website, they needed to know which
pages were leading users to successfully complete tasks, and which weren’t. They could do this with Google Analytics Integration.
They also wanted to look at screen recordings of people who came specifically to check subscription prices but failed. The problem with screen recordings is that you have too many videos to look through and you have to guess what the user tries to do. By integrating Task Analytics with Hotjar they could tag videos with an intended task, a completion rate, and even an audience. This way they could look at specific videos of those who failed to check subscription prices.
Curious about how many visitors fail on your website? Request a demo.