Have you ever asked yourself any of these questions when looking at your Google Analytics data?
If people find what they’re looking for quickly, then yes, it is good. If the site is too confusing and they simply leave, it’s bad.
Does a click indicate a customer found the answer on that page? Or did they expect to find it there, only to be disappointed?
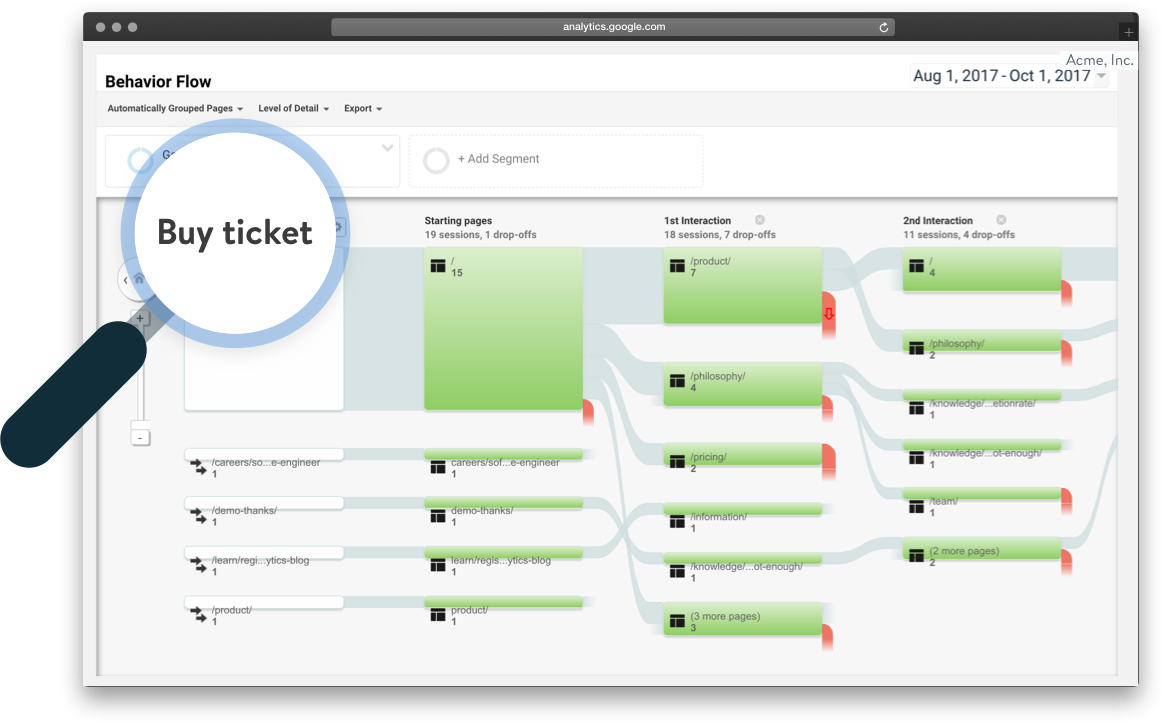
How do people navigate to solve their task? How do successful visitors navigate compared to the unsuccessful?
The challenge when analyzing web analytics data: you just don’t know if you’re dealing with a happy user or a frustrated user. Are visitors to your site finding what they’re looking for straight away? Great! A 100% bounce rate is what you’re aiming for. But if users are frustrated, and leave without finding the right page, you’re in deep trouble. Worse, if you don’t know why someone is visiting your website, it’s difficult to interpret their behavior when looking at web analytics—or even know whether they found what they needed. Analytics are great at tracking what the user is doing, but not so great at giving the why behind it.
Task Analytics helps identify why users visit your website, and if they were able to complete their task. Each user’s intent and completion score is sent to Google Analytics, allowing you to look at specific segments, specifics tasks and completion scores or failures. Knowing what a visitor’s goal helps you to determine whether the customer was successful, even when they don’t visit more than one page.
Task Analytics integrates seamlessly with Google Analytics to deliver deep insights that Google alone won’t be able to. Data from Task Analytics is sent to Google Analytics, giving you actionable information that helps you build stronger hypotheses about what users are doing.
Task Analytics enriches your Google Analytics data with an additional layer of information about users’ tasks—what they’re doing, and if they succeed. That allows you to create segments of users who were able to complete a specific task versus those who weren’t, and compare customer journeys and touchpoints for both segments, to understand the difference. Have non-successful users visited a specific page with broken links or outdated information? Do successful users use the search to get to the right page?
Users will give you clues as to why they weren’t able to complete a specific task. Perhaps they experienced a technical problem or were getting poor search results. Rather than spend hours puzzling over customer journeys and bounce rates for specific pages, you can quickly zoom in to problem areas.
The Task Analytics dashboard will help you spot trends and shifts in top tasks on a monthly, weekly or even daily basis. That means you can respond to current events or upcoming customer demands based on real-time data or historical data.
By integrating Task Analytics with Google Analytics you can segment visitors by task and completion rate, comparing customer journeys and touch points online.
See what happens when you add intent and success to your Google Analytics data. Request a demo.