You’ve started measuring the Completion Rate of your web visitors. You’ve overlaid intent with your Google Analytics. But now how do you estimate the impact to your business? Let’s take a look at a some simple formulas you can use to estimate increase in revenue and decrease in costs for moving the Completion Rate needle as little as 1%.
Let’s find the approximate magnitude (in dollars or your local currency) of a change in a single percentage point of your Completion Rate for a given time period.
First, let’s assume a few things. These assumptions can be tuned based on how you want to analyze your data.
Now, some basic definitions. Let:
If we want to find the value created by 1% of our revenue generating visitors :

Let’s take an example. Let’s say you run a travel booking site and receive 1M visitors a year. You’re measuring completion rate and can identify that (of those 1M visitors) 400,000 annually come to your site to book a travel package. Looking at your books, you’re current average order value is $200 per reservation.
In this example, that would mean:

Our business’s ΔR is computed as follows:

Assuming we maintain constant traffic and average order values (i.e. not changing our marketing or merchandising strategies), we can expect to generate $800,000 annually for ever percent we can raise the completion rate, year over year.
Let’s pretend we’re still in charge of a hotel booking site. How do we apply ΔRto cost or overhead? It’s easy! We just keep the equation the same, but we look at a different type of value for A.
Instead of average order value, we need to look at the average cost of customer service, which might be a bit tricky to figure out.
Let’s look at a pure cost-centric task our customers might perform: checking reservation status. If customer can’t check the reservation online for whatever reason, chances are they’ll pick up the phone and call. Now instead of low-cost self-service, the interaction becomes a high-cost agent-based interaction.
Whenever you’re working with agents, the common metric to use is average handle time. Let’s call this H: the average time a human agent spends servicing a customer.
Now let’s assume you’ve calculated an estimate of your annual overhead for your call center operations. Commonly, business will approximate a time-based measurement of this cost down all the way to the minute. Let’s define this as C and say it’s the cost per minute the business incurs.
For A , we can use some approximations. Let’s say the we look at our call center metrics and find our definitions of Average Handle Time and Call Center.
H [minutes] — 6 minutes for the average call
C [$/minute]— $2.50 / min overhead for our call center
So let's define A as:

In other words, our Average Handle Time A is fifteen dollars.
Let’s revisit our base formula. We now have an A that allow us to plug into our equation.
For N let’s say we get an even 1 million visitors per year to our site that intend to check reservation status. (We can easily pretend that if we get 1M visitors per the previous example trying to book a room that each person will try to check their reservation status once.)
Since ΔR is really just a magnitude, we use the same formula as before, but with our new value for A:

Wow. $150,000 for every percent annually!
Now imagine the value from both increasing Completion Rate for bookings as well as checking reservations!
First, we start with the definition of total revenue for a time period. We can say our total revenue R is equivalent to the number of customers that came to our site with intent to buy, N, times the Completion Rate Cᵣ, times the average order value A:

If we want the revenue when we increase the Completion Rate R by 1%, we simply add 1:

To find the change in revenue, ΔR, we simply take the difference of R₂ and R₁ :
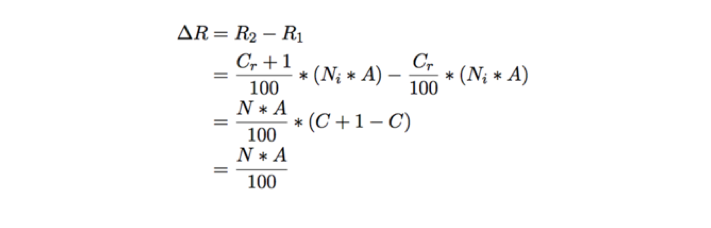
Voilà, we have our definition for the value of a change in Completion Rate!
Curious about how many visitors fail on your website? Request a demo.