Task Analytics is inspired by Gerry McGoverns top task methodology. We want to make it easy for any organisation to implement top task methodology and enable agencies to deliver their consulting around task management. Below is a description of how Task Analytics can be used as an alternative or in conjunction to traditional top task projects.
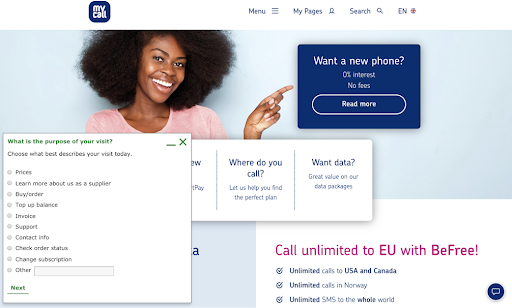
Task Analytics lowers the barrier to getting started with Task Methodology. Get started within minutes by deploying a survey that lets users describe their task with their own words. Collect enough open ended task descriptions that results in the traditional long list. The results can be used to set up the short list in the survey which can include up to 100 tasks. The difference from traditional long listing is that the tasks are automatically collected over some time instead of using multiple hours of research.
With our model for continuous measurement you can move away from doing short term projects to ongoing task measurement and regular reporting. Task Analytics has three main performance metrics
The difference from a traditional TPI is that these metrics are a result of real users trying to complete their task instead of moderated user testing.
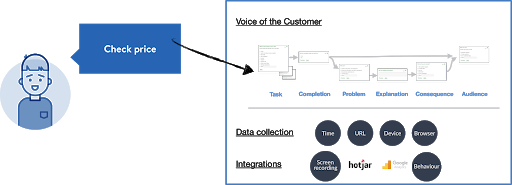
We use cookie settings to ask a percentage of visitors and maintain a steady stream of responses throughout the year. As a result you can discover important seasonal changes, compare performance before and after design changes, and discover challenges that your customers are facing. Ongoing measurement with feedback and data collection automatically creates an archive of real user experiences per task.
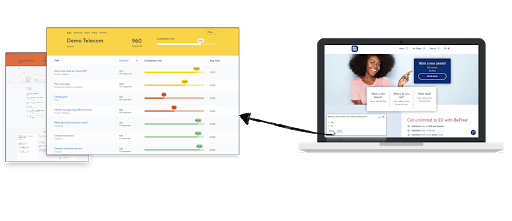
Spreadsheets are great to organize lots of data, but it also has limitations. With a dashboard multiple users can be invited to see the same data. Filters and a visual presentation makes it easier for anyone to dig through all the data and find valuable insights. A specialized survey and dashboard opens up new opportunities to collect a wider data set about each task. Task Analytics places tasks at the center so it becomes the context all feedback and data points from each user session is stored.
Task Analytics places tasks at the center so it becomes the context all feedback and data points from each user session is stored. Below is a list of the main features Task Analytics brings in to task management. View the full list here.
Task Demand
Task Performance
Task Insight
Segmentation
Integrations
Integrate tasks and completion score data with other tools
Read more about integrations*Integration with Google Analytics
**Integration with Hotjar or Mouse Flow